Furkan Mamuk
I turned off the accretion disk because I wanted to see what the Milky Way was doing on its own. The bright arc stayed. So did the dark dust lanes curling around the shadow. Farther in, there seemed to be another copy of the same structure.
That was the interesting bit. Was I seeing the same part of the sky twice, or had I just made a very convincing-looking mistake?
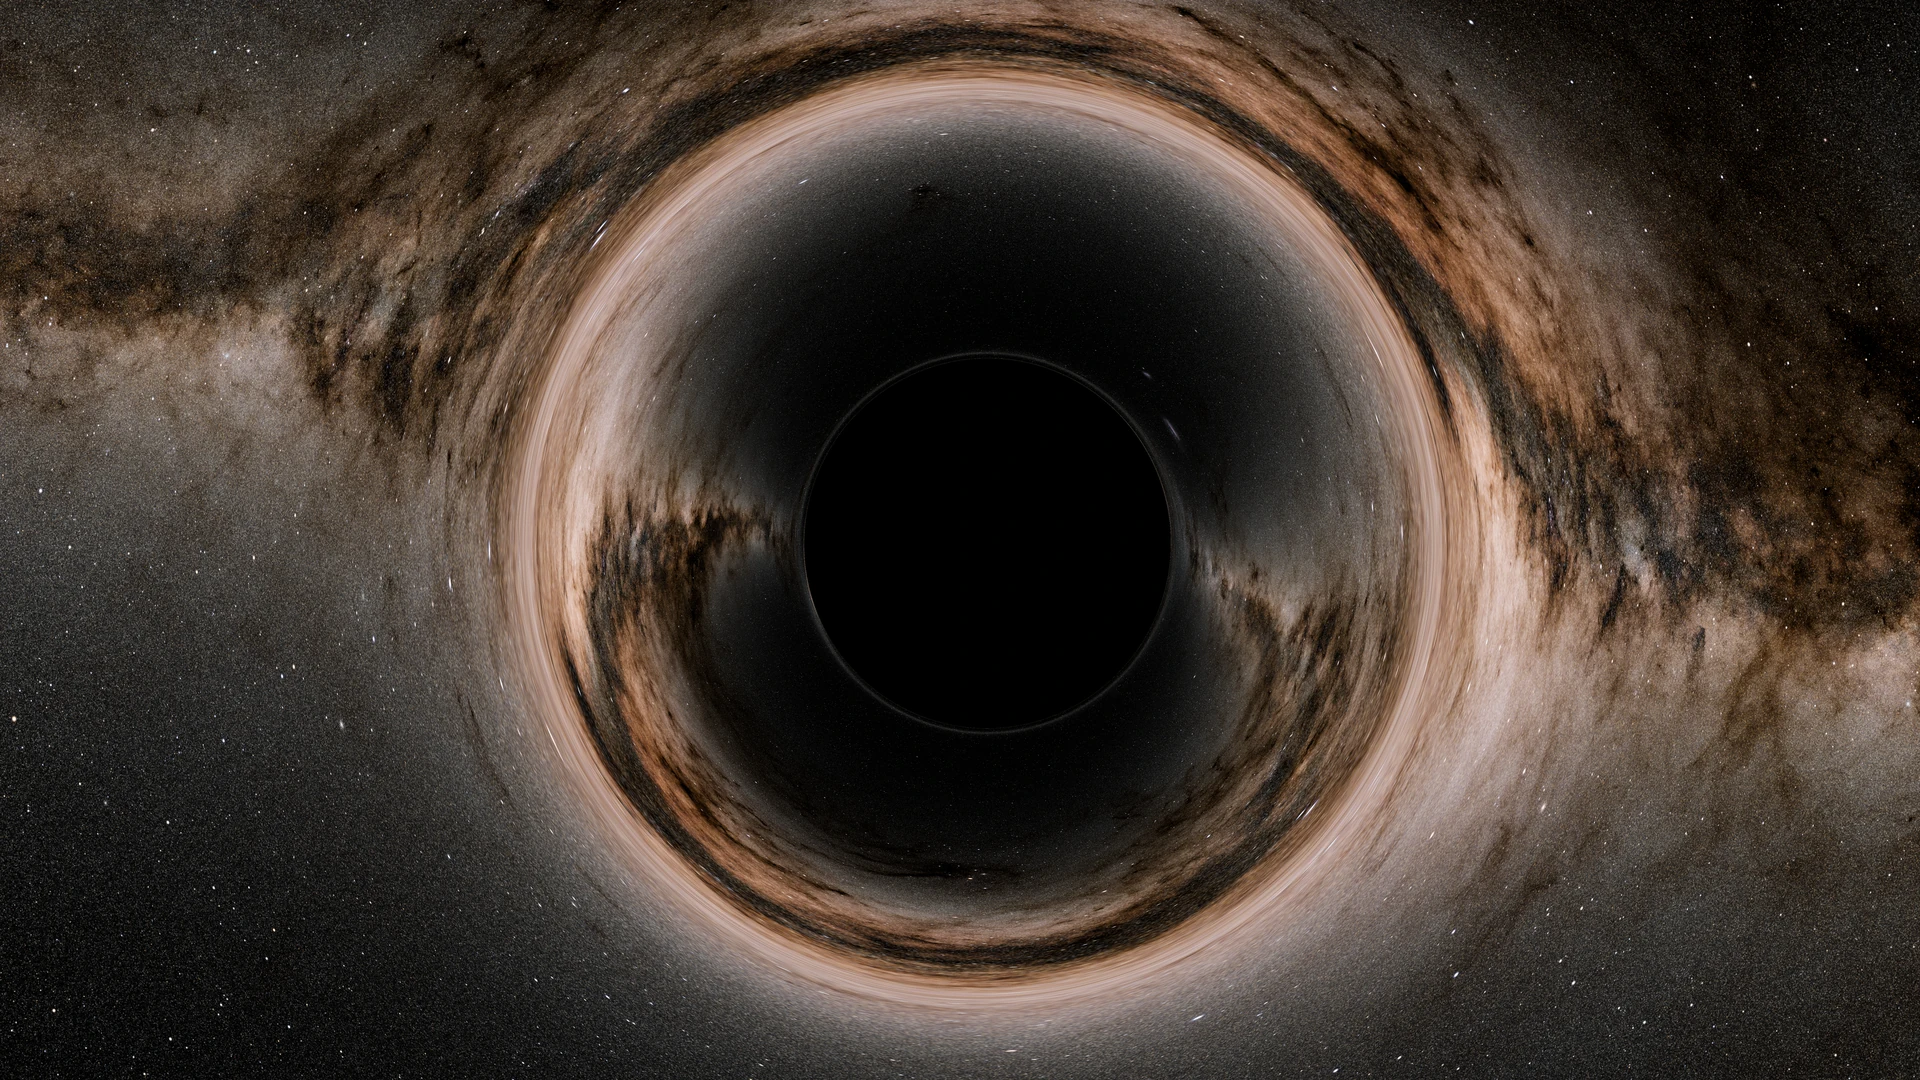
The background is NASA Goddard’s 16K Galactic map from Deep Star Maps 2020. I put the camera at an exterior viewpoint in Kerr spacetime, with spin a/M = +0.5, and kept the exposure fixed. The 7680×4320 still was rendered in four tiles, each covering its own section of the same camera frustum. On my RTX 4060 the four runs took about 158 seconds altogether, including a fixed 30-second wait before each capture, startup and loading the map. That’s total process time, not just GPU rendering.
Following the streaks back to the sky
Each pixel starts with a ray traced backward from the camera. If the ray escapes, its outgoing direction tells me which point in the distant sky map to sample.
I also have a control render with the bending disabled but a simple geometric capture silhouette left in place. It isn’t supposed to be a physical black-hole image. It just lets me separate what the lensing does from what was already in the map. The crops below use the same framing.
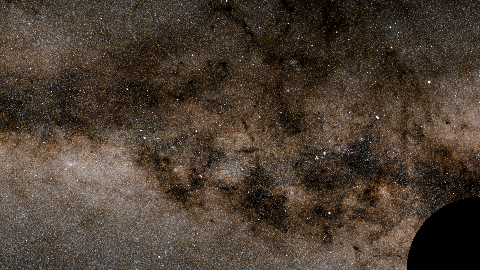
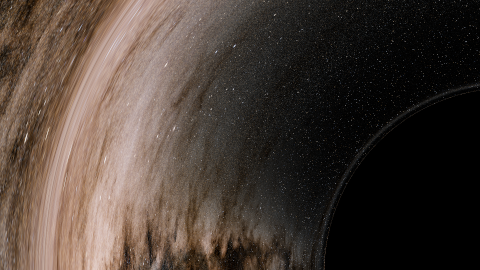
For the possible duplicate, I marked three circular patches in Galactic coordinates. A rendered pixel gets a tag only if its ray escapes toward that particular patch. Each patch shows up on opposite sides of the image, pulled into different shapes and sizes.
So those separated shapes really do trace back to the same regions of the source sky. I don’t have to guess from how much the bright streaks resemble each other.
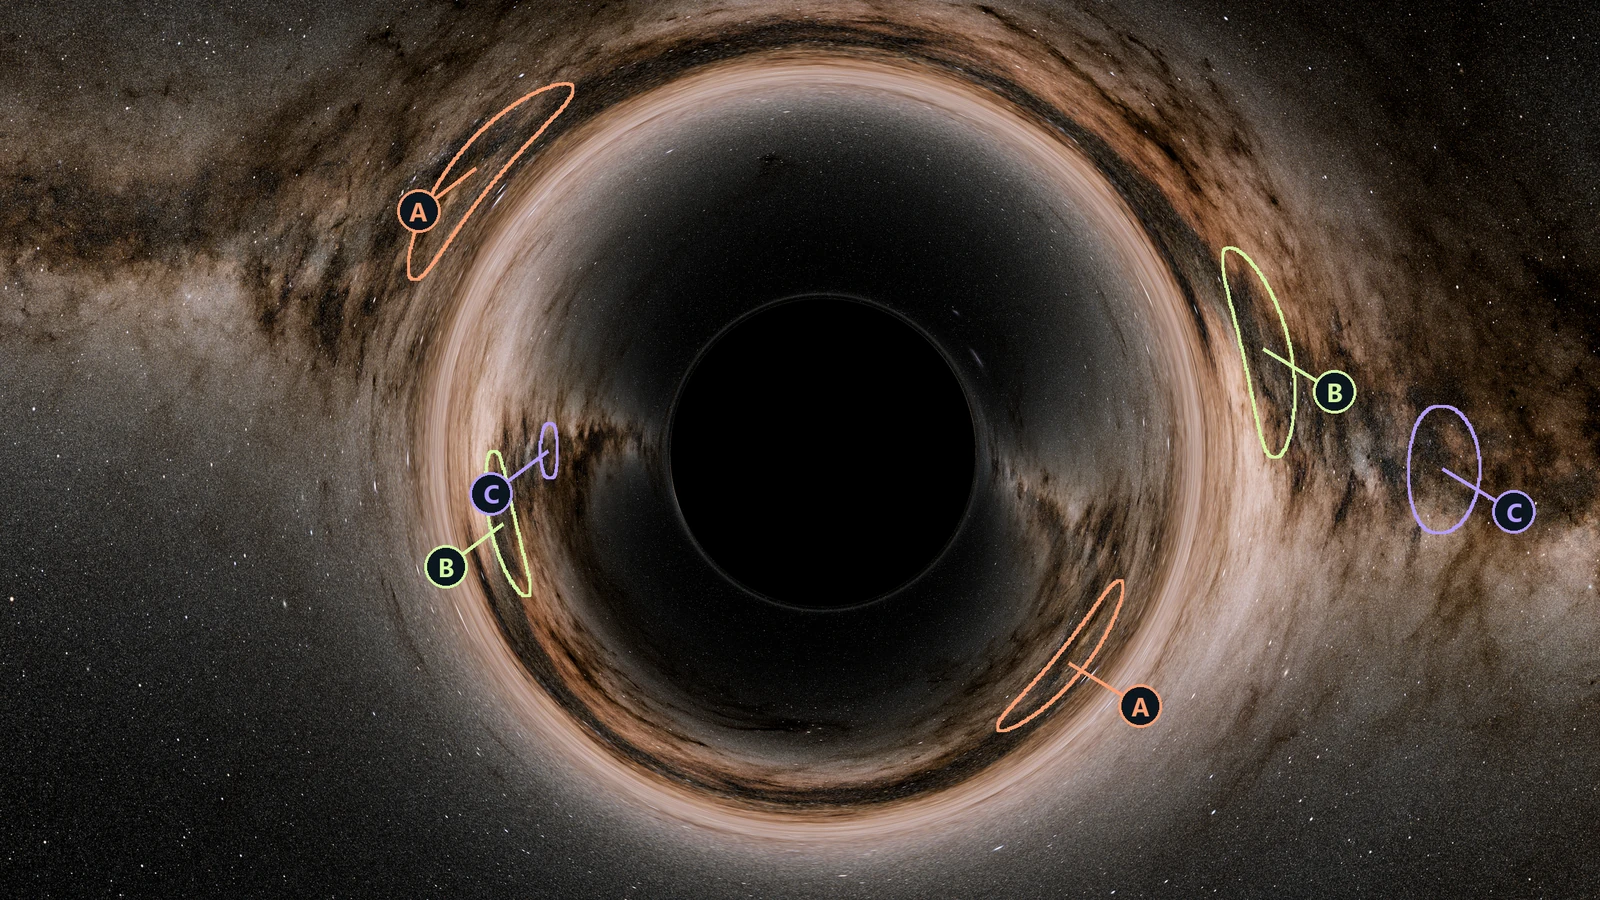
The patches have an angular radius of 2.25°, at Galactic longitudes −12°, +4° and +18°, all on latitude zero. The coloured outlines are a diagnostic overlay, not part of the rendered sky.
Then I gave it more rays
A 16K sky map sounds reassuring until you remember what happens to the camera rays near the shadow. Two neighbouring pixels can end up looking at entirely different parts of the sky. The source can be perfectly detailed and the rendered image still be undersampled.
I picked a crop with the broad arc and the thin shadow rim, and rendered it at 1080p, 4K and 8K angular densities. I changed neither the camera nor the sky map nor the exposure. After tone mapping, I averaged in display-linear light to bring each result onto the same 480×270 grid.
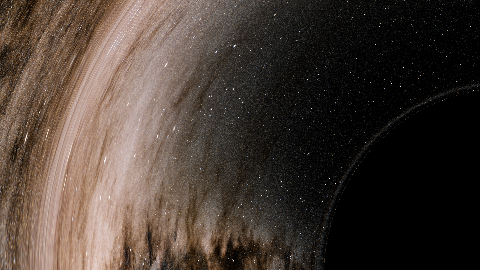
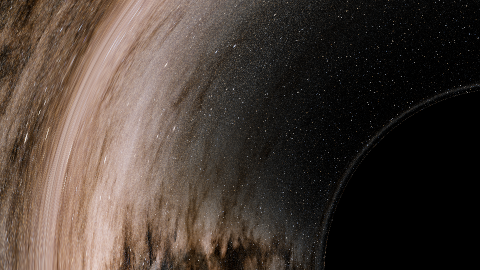
The broad arc doesn’t go away. That’s reassuring. The thinner streaks are less settled; some move or soften as I increase the ray density, and the shadow rim changes in places too. The difference image shows where the extra samples matter.
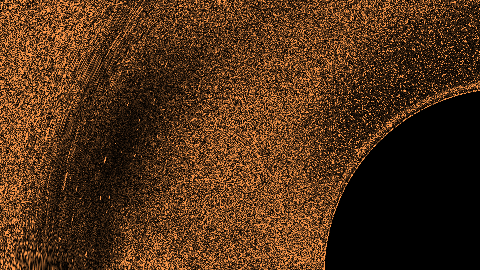
| Change on the same crop | Mean absolute change in 8-bit display luma |
|---|---|
| 1080p rays compared with the 8K reference | 6.461 |
| 4K rays compared with the 8K reference | 3.555 |
| Half to quarter integration step at 4K | 0.082 |
| Sky footprint filter off to on at 4K | 3.157 |
| 8K to 16K source map at the configured gains | 24.037 |
The table is about display luma in this crop, not about physical error in the whole renderer. The 8K-to-16K source-map change also changes brightness at the configured gains, so that 24.037 isn’t a clean detail-only comparison. The sky footprint filter depends on the ray grid as well. Halving the integration step barely changed the mean here (0.082), but there were individual pixels with much larger differences.
And 8K isn’t a converged truth image. It’s simply the densest camera grid in this set.
I can account for the repeated broad structure by tracing it back to the Milky Way map, and it survives the denser ray grid. The very fine streaks are another matter. I like how they look, but I need more samples before I trust their shapes.
Credits
Sky map: Deep Star Maps 2020, NASA Goddard Space Flight Center Scientific Visualization Studio, Ernie Wright, ESA/Gaia/DPAC and the source catalogues.