Furkan Mamuk
A crescent is not much of an accuracy test. I can make something that looks like a black-hole image without knowing whether the light in it has been computed correctly.
I wanted to compare my GPU renderer with ipole on something narrow enough that a pixel-level disagreement would actually tell me something.
I used a static 320×180 camera, spin +0.5 and one packed KHARMA snapshot. The model includes unpolarized thermal synchrotron emission and absorption at 230 GHz. The fluid state comes from an external simulation. My code traces photons through those stored fields; I’m not evolving the plasma myself.
Both intensity images use the same logarithmic display scale. They look close, which is nice. The signed residual is much more useful: it shows where one renderer gives more light than the other.
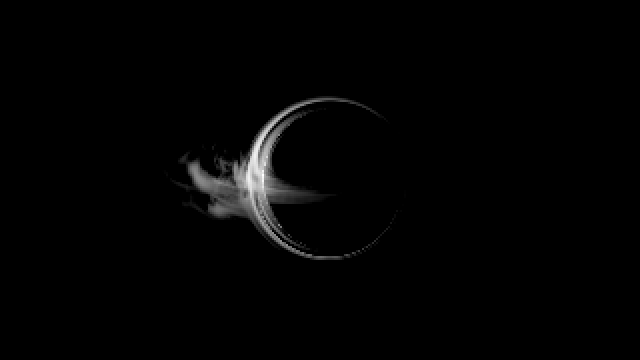
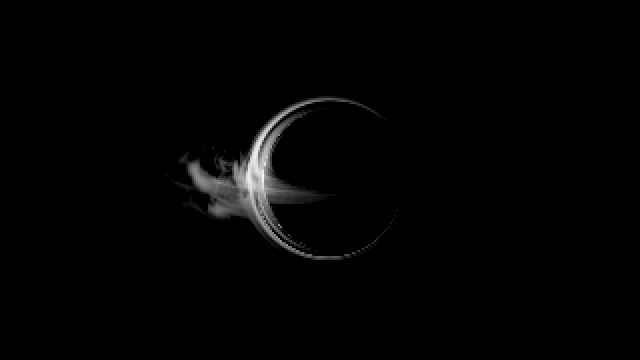
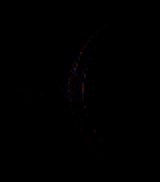
The snapshot comes from Illinois v3, by Dhruv and colleagues, under CC BY 4.0.
Getting both codes to solve the same problem
Matching the spin and field of view didn’t get me very far on its own. I also had to match the camera frame, pixel centres, launch momentum, plasma interpolation, local frequency, transfer coefficients and observer intensity normalization.
If those differ, the two renderers can disagree for perfectly good reasons. I wanted the numerical methods to be the thing under test.
ipole traces its own geodesics and runs its own radiative-transfer integrator. The GPU uses its own bounded paths and samples the transfer at the midpoint of each step. The defined emission model and near-horizon cutoff are shared. That is the useful part of this setup: they aren’t identical implementations, but they’re being asked the same question.
I compare linear FITS intensities, not the displayed pictures. There’s no fitted exposure, blur, registration or flux rescaling hiding in the score. ipole is a public relativistic radiative-transfer code; my local adapter deliberately restricts it to the matched, unpolarized case used here.
Reading the two numbers
Weighted L1 sums the absolute intensity differences, weighting each pixel by its camera solid angle, then divides by the integrated reference intensity over the pixels finite in both images. The signed integral difference keeps the signs. Too bright in one place and too dim in another can cancel out in that second number.
I keep both because they don’t measure the same failure.
| GPU affine step factor | Weighted L1 difference | Signed integral difference |
|---|---|---|
| 1 | 0.9549% | +0.0850% |
| 0.5 | 0.2846% | +0.0186% |
| 0.25 | 0.1461% | +0.0204% |
All 57,600 pixels are finite in the final pair. Reducing the GPU affine step brings weighted L1 from 0.9549% down to 0.1461%. The signed integral difference doesn’t move quite so neatly: it’s +0.0186% at the half step and +0.0204% at the quarter step. I don’t want to hide that just because the L1 result improved.
ipole changes with its numerical settings as well. Halving its step parameter from 0.003 to 0.0015 changed its own image by 0.0613% weighted L1. That’s a comparison between those two ipole runs, not an estimate of the remaining error.
What I can actually claim
This is one packed snapshot, one fairly small camera and one emission model. It doesn’t measure errors introduced by packing the fluid fields. It isn’t a comparison with telescope observations, and it doesn’t validate every assumption in the emission model.
The inclined, native-grid slow-light comparisons are different tests. They can run into missing simulation history as well as integration and sampling errors.
There’s also the question of what gets excluded from the image. The FITS exporter keeps paths that exhausted their step budget, and paths with unavailable history, separate from ordinary valid intensities. Comparing the common finite pixels is fine as long as those masks are reported. A low difference over the surviving pixels doesn’t explain the missing ones.
So the useful result is 0.1461% weighted L1 against ipole for this camera, snapshot and transfer model. I’m happy with it. I wouldn’t put that number on a different scene without doing the comparison again.
Credits
Plasma snapshot: Illinois v3 KHARMA data, Dhruv, Prather, Wong and Gammie, CC BY 4.0. Numerical reference: ipole.